
Posts Tagged ‘Canada’
Friday, July 5th, 2019
Article source: ConstructConnect
Strong U.S. Jobs Growth has Interest Rate Implications
The U.S. total number of jobs in June shot up by +224,000, according to the latest Employment Situation report from the Bureau of Labor Statistics (BLS). A slight rise in the ‘participation rate’, to 62.9% from 62.8% in May, caused June’s unemployment rate to climb a notch, from 3.6% to 3.7%. A 3.7% level of unemployment is still remarkably tight.

Everyone’s keeping a close eye out for signs of a weakening U.S. economy that would warrant an interest rate cut by the Federal Reserve (Graph 1). They won’t find justification for such a move in June’s jobs numbers. May’s lackluster +75,000 addition had pointed to trouble possibly brewing, but that’s become old news. It’s been superseded by fresh buoyancy.
It should be pointed out, however, that the jobs performances in some sectors have taken an interesting turn of late. This will be examined in the next section.
Worth noting, also, is that despite June’s strength, average monthly job creation in the U.S. so far in 2019 has been +172,000. With half a year having already sped by, +172,000 is a decline of more than a quarter (-26.8%) compared with January-to-June 2018’s average of +235,000.
(more…)
Tags: Alex Carrick, Canada, ConstructConnect, Construction industry, Construction services, Economist, Economy, employment, Growth, jobless, jobs
Comments Off on June Jobs Reports: U.S. Bounces Back; Canada Weak M/M but Strong Ytd
Tuesday, May 14th, 2019
Article source: ConstructConnect
Canadian total employment shot up by +106,000 jobs in April, and the nation’s unemployment rate declined to 5.7%, according to the latest Labour Force Survey findings from Statistics Canada.

March’s jobless rate had been 5.8%. The month-to-month improvement in the out-of-work proportion would have been greater if not for the fact that the ‘participation rate’ climbed from 65.7% to 65.9% between the third and fourth months of this year. (A higher participation rate means that more people are actively on the hunt for jobs.)
The average monthly gain in total employment in Canada through the first third of 2019 has been +55,000, a robust hike. From January to April of last year, the average monthly change in the total Canadian jobs count was -2,000.
Since April 2018, total employment in Canada has risen by +426,000 jobs, a notable achievement.
(more…)
Tags: Alex Carrick, Canada, jobless, jobs
Comments Off on Explosive Jobs Growth in Canada’s April Labour Force Report
Friday, May 3rd, 2019
Article source: ConstructConnect
Explanation of Quarterly and Annual GDP Percent Change Calculations
The mathematics employed to calculate ‘real’ gross domestic product (GDP) levels and rates of change are more convoluted than one might suppose. For a new quarter, GDP line items (e.g., consumption, investment, government spending and exports/imports), after removing the effects of inflation, are added up and adjusted for seasonality. They are also expressed as if they are annual results – i.e., the quarterly figures are ‘blown up’ to a corresponding annual level.

The ‘official’ GDP figure for any year is the average of the levels for the four quarters within that year and the year-to-year growth rate is the percentage change between annual averages.
The figure most often quoted by the press, however, is a quarter-to-quarter GDP growth rate annualized. Such a number compares latest-quarter GDP with previous-quarter GDP to derive a percentage change. Then that percentage change is compounded to the power of four (i.e., ‘annualized’) to account for four quarters in a year.
(more…)
Tags: Alex Carrick, Canada, construct, ConstructConnect, Economist, Economy, GDP, US
Comments Off on Prolonged Streak of U.S. Beating Canada in Q/Q GDP Growth
Thursday, March 7th, 2019
Article source: ConstructConnect
Issuance of year-end data on U.S. new homebuilding activity was delayed due to the partial government shutdown which kept Census Bureau workers away from their desks.

Over the past month, however, there have been diligent catch-up efforts and December’s preliminary residential ‘starts’ and ‘permits’ numbers are now available.
There are ‘starts’ at the national level; but for states and cities, the figures are based on building permits.
This article will mainly concentrate on new home groundbreakings in America’s largest metropolitan statistical areas (MSAs). ‘Permits’ in units will be accepted as equivalent to ‘starts’.
‘Permits’ are first published by the Census Bureau, then repackaged in a more user-friendly form by the National Association of Home Builders (NAHB).
When Canadian statistics are mentioned, they have been made available by Canada Mortgage and Housing Corporation (CMHC) and they are ‘starts’.
(more…)
Tags: Alex Carrick, atlanta, Austin, Canada, Charlotte, chicago, ConstructConnect, Construction industry, Denver, Economic, employment, Houston, los angeles, Miami-Ft Lauderdale, minneapolis-St paul, MSA, nashville, New york, orlando, phoenix, residential, san francisco, seatttle, Tampa, washington DC
Comments Off on 2018 Residential Construction Market Highlights − U.S. and Canada
Monday, March 4th, 2019
Article source: ConstructConnect
The table and maps accompanying this article feature comparisons of highway, street and roadwork construction starts in all the states, plus District of Columbia, in two ways: (1) by dollar-volume level, taking the annual average over the past two years (2017 and 2018); and (2) per capita (i.e., the dollar volume in (1) divided by each individual state’s population).

In some states, there can be considerable variation in the dollar volume of roadwork starts from one year to the next. Therefore, it seems only fair to smooth the series out a bit, and hence the reason for utilizing a latest-two-years average.
On the left-hand side of Table 1, there is a ranking of all states and D.C. according to their level of roadwork construction starts. Sixteen states have exceeded an annual average of $1.0 billion over the past two years and they are highlighted in Map 1. Washington state, at $995 million, and New Jersey, at $980 million, just missed the cut.
(more…)
Tags: Alex Carrick, Canada, construct, ConstructConnect, Construction, Construction industry, Construction services, Economist, Economy, market
Comments Off on Rankings of States and Provinces by Roadwork Construction Starts
Wednesday, February 27th, 2019
Article source: ConstructConnect
Early in February, there should have been the release of December 2018 foreign trade statistics for both the U.S. and Canada. The publication schedule has been thrown off track, however, by the 35-day partial U.S. government shutdown, which kept Census Bureau workers off the job.

Since three-quarters of Canadian exports are shipped to the U.S. and two-thirds of Canadian imports are drawn from the U.S., Statistics Canada felt it could not publish accurate numbers either. Therefore, the latest statistics available for study, both south and north of the border, are for November. A statement has been issued that the target date for dissemination of December findings is March 6th.
Nevertheless, there is much to be learned from the material that is at hand. The bottom line is that there has been minimal progress lately in fixing significant U.S. and Canadian foreign trade difficulties.
Graphs 1 and 2 tell the story. Canada’s trade deficit (annualized) in November was -$25 billion CAD; America’s was a massive -$592 billion USD.
(more…)
Tags: Alex Carrick, Canada, ConstructConnect, employment, Foreign Trade, Growth, home
Comments Off on Minimal Progress in Fixing U.S. and Canadian Foreign Trade Difficulties
Friday, February 1st, 2019
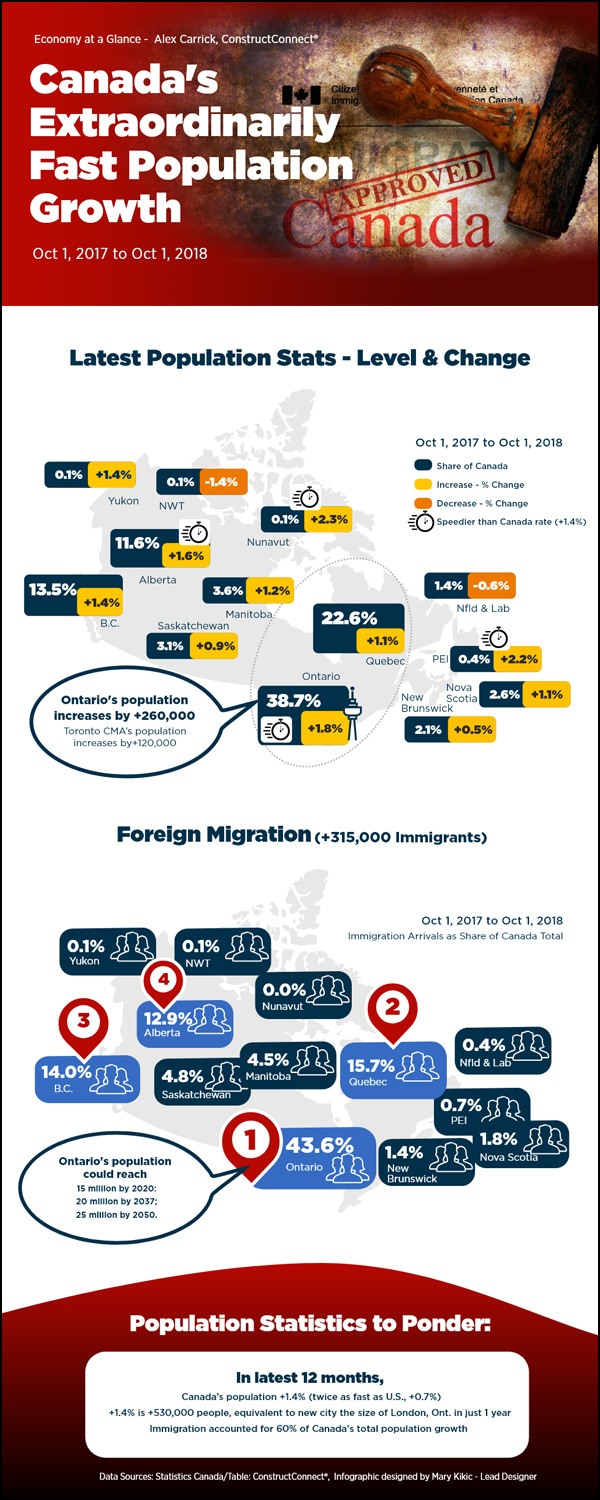
Due to its complexity, much of the subject matter concerning the economy requires detailed editorial commentary, often supported by relevant tables and graphs. This infographic looks at Canada’s extraordinarily fast population growth and the latest statistics.

At the same time, though, there are many topics (e.g., relating to demographics, housing starts, etc.) that cry out for compelling ‘short-hand’ visualizations.
Whichever path is followed, the point of the journey, almost always, is to reach a bottom line or two.
To provide additional value at its corporate blog site, ConstructConnect is now pleased to offer an ongoing series of Infographics.
These will help readers sort out the ‘big picture’ more clearly.
Click Here to view the latest infographic.
To view more infographics, Click Here
Also read the related article, “15 Bullet Points on Canada’s Extraordinarily Fast Population Growth“.
Tags: Alex Carrick, Canada, ConstructConnect, Construction industry, Construction services, Economic, Economist, population
Comments Off on Infographic: Canada’s Fast Population Growth
Thursday, January 17th, 2019
Article source: ConstructConnect
Well this is a fine pickle, I must say. I’m about to try writing a Nuggets report based on the latest statistical releases and many of the U.S. economy’s key data series have not been updated due to the federal government shutdown. Workers at the Bureau of Labor Statistics (BLS), which compiles jobs numbers and inflation rate figures, are still toiling away. But workers with the Census Bureau, which monitors foreign and retail trade, plus housing starts, are off the job.

The number of individuals employed by Washington on a normal workday is a little less than three million. Of that total, and with their paychecks being withheld, 800,000 are now staying at home or working for free. The figure grows considerably larger when sidelined contract workers are included in the tally. To date, this is taking a minor toll on consumer spending, but the impact will become more onerous the longer the stalemate between the President and the House lasts.
Prior to recent developments, the story concerning government employment has been largely snooze-inducing. The three levels of government employment – federal, state and local − account for 22.4 million jobs in total. The shares provided by each level have stayed relatively constant over the past ten years. Almost two-thirds (64.5%) of such workers are at the local level; almost one-quarter (23.0%) at the state level; and the remaining 12.5% at the federal level.
(more…)
Tags: Alex Carrick, Canada, Construction, federal government shutdown, manufacturing
Comments Off on 8 Mid-January Economic Nuggets
Tuesday, January 8th, 2019
Article source: ConstructConnect
The total number of jobs in the U.S. rose by +312,000 in December, according to the latest Employment Situation report from the Bureau of Labor Statistics (BLS).

There was only one other month in 2018 with a greater surge in jobs creation, February at +324,000.
Optimism over hiring prospects caused the participation rate in December to climb to 63.1% from 62.9% the month previously (i.e., more out-of-work individuals decided to rejoin the labor force). The side effect was that the unemployment rate moved up to 3.9% from 3.7% in November.
The large month-to-month gain in jobs in December understates the overall improvement, since there was also a substantial positive revision to prior data. A month ago, the BLS reported a total jobs level of 149.893 million. It is now saying that November’s figure was really 149.951 million, an increase of +58,000.
Therefore, December’s just-reported level of 150.263 million exceeds November’s first-reported level of 149.893 million by +370,000 jobs.
By industry sector, the largest revisions to November’s jobs statistics came from ‘retail’ (+18,000), ‘government’ (+16,000) and ‘leisure and hospitality’ (+14,000).
(more…)
Tags: Alex Carrick, build, Canada, CMD, ConstructConnect, Construction, Construction services, Economic, Economics, Economist, jobs, Labor, manufacturing, market, money
Comments Off on December Jobs Reports: U.S. Ends 2018 with Bang; Canada with Whimper
Monday, December 17th, 2018
Article source: ConstructConnect
The tail that is attempting to wag the dog these days is the stock market. With only two weeks remaining in 2018, America’s major stock market indices have moved, at best, sideways versus close-of-year 2017. The Dow Jones Industrial Index (DJI) is currently -0.5% relative to its closing level on December 31 of last year. The S&P 500 is -0.9% and NASDAQ, -2.4%.

North of the border, the Toronto Stock Exchange is -9.0% compared with year-end 2017.
The FANG stocks have been leading the retreat in equity prices. Since the summer of this year, the share price of Facebook, which has experienced confidentiality problems galore, is -29.2%; Amazon, the retail sector’s ‘disruptor-in-chief’, is -19.9%; Netflix is -34.1%; and Google/Alphabet, -16.2%. Even Apple has moved out of favor, -26.3%. On August 2nd, Apple became the world’s first trillion-dollar company, but of course that valuation no longer stands.
The Federal Reserve has been paying attention. Earlier, the Chairman of the Fed was adamant that he wanted to see the federal funds rate return to its ‘equilibrium’ or neutral level of 3.00%. Neutrality is when prevailing interest rates are neither too stimulatory nor too contractionary.
The current level of the federal funds rate is in a range of 2.00% to 2.25%. The likelihood is still high there will be another 25 basis-point (where 100 basis points equals 1.00%) increase later in this month of December. The schedule for next year, however, is no longer as firmly established. Fed Chairman, Jerome Powell, has stated that future action on interest rates will be ‘data driven’.
By the way, the stock markets also really don’t like the tariff skirmish with China. Whenever there is even a hint of a resolution of that dispute, investors respond ecstatically.
(more…)
Tags: Alex Carrick, build, Canada, ConstructConnect, Construction industry, Construction services, Economic, Economics, Economist, Growth, home, US
Comments Off on 13 Mid-December Economic Nuggets
|


 Animation, 3D Art and 3D Models")