| |
Appendix C
Verilog Coverage Analysis - Worked Examples
Although TransEDA's coverage analysis tools will operate on various platforms with different types of simulators, the following assumptions have been made in order to simplify the number of steps in these worked examples and case studies.
If you are using a different platform or simulator than the ones listed above, please contact TransEDA for an alternative set of instructions on how to run the worked example and case study.
Getting Organized
It is assumed that Verification Navigator version 2002.03 or later and ModelSim have been installed on your system according to the vendors' instructions; that the environment variables and search paths have been set up and that the software operates correctly. If this is not the case please contact the vendors' technical support department for further assistance before going any further.
The various Verilog design files, configuration files and associated batch files needed for the case study can be obtained as a single file in `zip' format from TransEDA's web site at: www.transeda.com/vmm/
If you encounter any problems in obtaining the `zip' file please contact TransEDA at the following e-mail address.
Directory and File Structure
Create a directory (e.g. my-verilog) on your system and then unpack the complete set of files that you obtained in the above step into that area. Make sure the directory contains the following files and the filenames and suffix are correct.
Command Line Batch File
A command line batch file is supplied which can be used to automate the process of analyzing and instrumenting the Verilog source files, running the simulation and collecting the activity-data for the history file. To assist you in understanding the operation of this stage, each line of the batch file (doit.modelsim.bat) is annotated below.
Lines 1 to 3 create a library to hold the design files that will be analyzed and instrumented. As it is not normal practice to instrument the test bench this is compiled outside of the coverage analysis tool using the command given by Line 4. The Verilog source files that make up the complete design that need to be analyzed and instrumented are listed in the circuit.f file. This information is passed to VN-Cover by the command given on Line 5. The syntax for this particular command is given below.
Although it is normal practice to use a file to hold a list of the Verilog source files that are used in the design, the names of the source files could be passed to VN-Cover on separate lines as shown below.
Line 6 specifies the name of the test bench or top-level module (e.g. test_monitor) and runs a normal Verilog simulation to collect the activity-data for the complete design. This information is written to a history file that has a default name of vnavigator.index. Line 7 is a post-processing stage that creates a series of text files that gives detailed coverage information for each instance of each module in the design. These files can be viewed with a simple text editor
Parameter File (Global and Local)
Verification Navigator uses a parameter file called vnavigator.par to define how the coverage analysis tool is used and the types of coverage measurements applied to your design. A global parameter file, that is located in the area where you installed the coverage analysis software, defines all the default settings for Verification Navigator. A local parameter, that is located in your working area, enables the default settings to be overridden. An explanation of the contents of the local parameter file is listed below.
Line 1 sets Verification Navigator to use the ModelSim Verilog simulator running on a Windows-NT platform. Lines 2 to 8 define the types of coverage analysis measurements to be instrumented during the HDL code analysis phase.
Collecting Coverage Results
Make sure you are positioned in the directory that you created to hold the Verilog source files. Invoke the command line batch file by entering the following text string.
This action will automatically invoke the VN-Cover part of Verification Navigator and carry out the following steps.
The name of the results file is: vnavigator.index which is located in the default sub-directory: vnavigator_results
Viewing Coverage Results
There are two ways to view the detailed coverage information that was produced by the command line batch file. You can either inspect the contents of the coverage files with a text editor or use the GUI (graphical user interface) that is available within VN-Cover. This worked example will make use of the graphical user interface which can be invoked by entering the following text string.
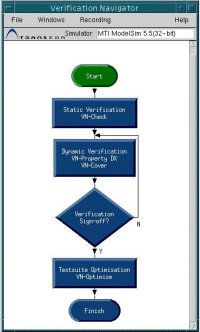
This action will bring up a top-level flowchart, as shown in Figure C-1, to guide you through the various tools that are available within Verification Navigator's verification environment.
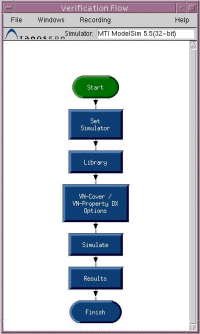
The Verification Flow flowchart, as shown in Figure C-2, is used to allow you to interact graphically with VN-Cover to create libraries, select the design files that you want to instrument and set up communication with your chosen simulator. As we have already generated the results file using the command line script (doit.modelsim.bat) we can skip this stage and move on to inspecting the coverage results.
Click the Results button - the sixth button on the flowchart.
This action will bring up the window as shown below.
Click the Load Results Files button to display the results files that are available.
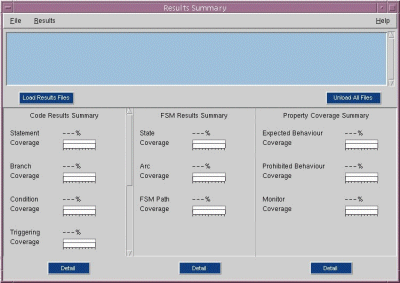
Select the file labelled vnavigator.index by clicking the corresponding entry in the Results File(s) pop-up window. This action will load the requested results file into Verification Navigator's internal database area. A summary of the coverage that has been achieved is displayed in the Results Summary window.
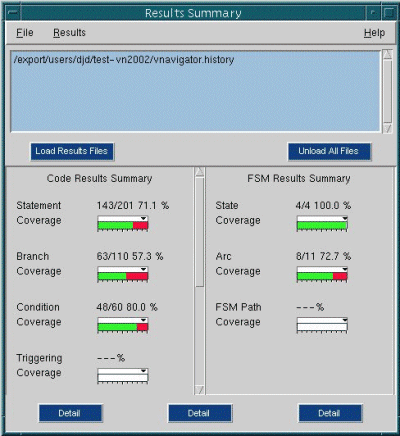
Clicking the Detail button, at the base of the Results Summary window, will enable you to obtain detailed information about coverage in specific parts of the design. The action of clicking the Detail button will cause the display screen to change and become populated with the set of six windows as shown in Figure C-5.
The Flow Manager window is really an iconised version of the Verification Flow window and can be used as a way to return to the main flow if you need to repeat the instrumentation or simulation phases.
The right-hand section of the Hierarchy window, as shown in Figure C-6, shows a summary of the coverage measurements for the section of the design's hierarchy that is currently selected. At the moment the whole of the design's hierarchy has been selected so what is indicated is a global summary for the whole of the design.
As you move around the design by clicking the appropriate module or instance in the hierarchy viewer the summary values change to reflect the coverage at that particular level. The information displayed in the Hierarchy window enables you to identify quickly the areas of your design that have poor coverage. An inter-window communication process links the Hierarchy window with the Metric View window (as shown in Figure C-7) and enables you to inspect specific coverage metric values for individual modules or instances. Although the Hierarchy window is basically a static window, the Metric View window is dynamic and enables the individual values for the coverage measurements to be displayed by clicking the appropriate metric tab located along the top edge of the window.
Figure C-7 shows an example of how the coverage information is displayed when the Statement tab has been selected.
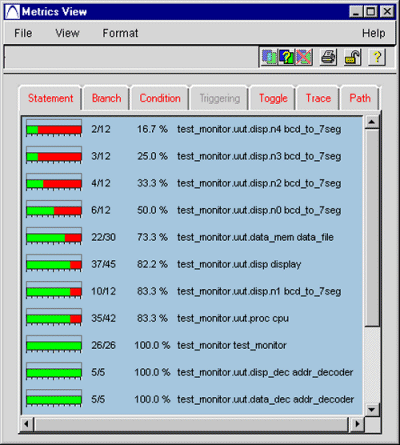
Modules or instances that have poor coverage are listed first and color-coded to assist you in identifying the areas of the design that need your attention. In this particular example, there is poor coverage with the bcd_to_7seg module-instance which indicates that extra test vectors need to be added to the test bench. At this stage you can try clicking some of the other metric tabs along the top edge of the window to ascertain the amount of coverage that has been achieved for Branch, Condition, Path, Toggle and Signal-Tracing. Please refer to Chapter 6 for details on how to interpret each of these coverage measurements.
A Code View window communicates with the Metric View window and is used to locate the source code for each instance. Figure C-8 shows how the Verilog code is displayed in the Code View window. The example here relates to the ALU code for the `cpu' contained in the `proc' module. Various lines of code are highlighted indicating inadequate coverage. This particular example highlights the problems with inadequate statement coverage by identifying the lines of code that have a zero execution count. You can examine the problems with the other coverage measurements by clicking the appropriate tab across the top edge of the Code View window.
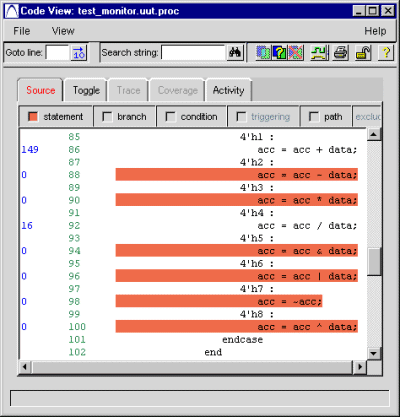
It is a simple matter to locate and identify statements that have zero execution counts. However some of the more powerful coverage measurements may require further explanation in order to identify exactly what is wrong with a section of Verilog code. A Detailed View window is available for this purpose. If you click on a particular line of code, the Detailed Code View window will be invoked to display in-depth information. The resultant action that you need to take will probably involve altering the test vectors supplied by the test bench or modifying a section of Verilog in the corresponding source file.
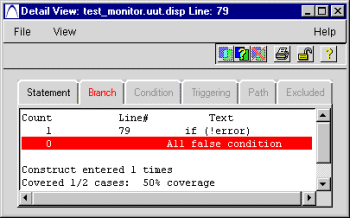
Figures C-9 to C-12 show how the Detailed Code window reports problems associated with branch coverage, condition coverage, path coverage and signal trace coverage respectively.
The worked example described in this appendix should help you in developing some basic experience and confidence in using a coverage tool. It is suggested that once you have completed this simple example you try using the coverage tools with one of your own projects.
If required, additional practical exercises can be obtained from TransEDA and can also be found in the `example' directory where Verification Navigator was installed on your system.
The error reported in Figure C-9 indicates that the branch at line 79 has always been taken because the value of !error has always been true. (i.e. logic 0.) An additional vector is needed in the test bench to set !error=1 and thus increase the branch coverage to 100%.
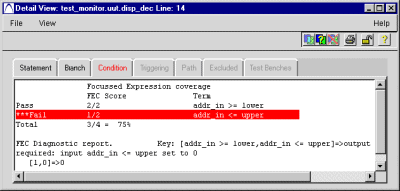
Figure C-10 indicates that one of the terms in the complex `if' statement on line 14 has failed to control the expression. Please refer to Chapter 6 for details on how to interpret the diagnostic messages for focussed expression coverage.
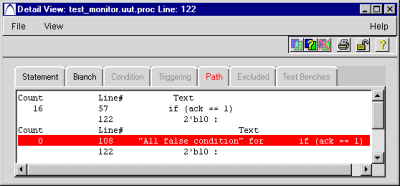
The report shown by Figure C-11 gives details of which combinations of paths through the `if' and `case' constructs have not been covered.
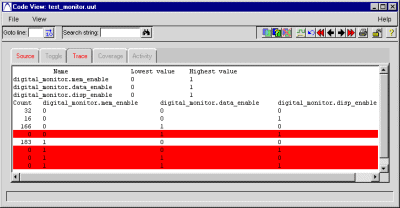
One useful coverage measurement that was described in Chapter 6 is variable-trace. This technique is particularly useful at the functional or black box testing stage. A data file, which is normally formatted as a simple text file, is used to define the names of the signals/variables to be traced. If you inspect the contents of the file data_bus.var you can see the signals that have been traced. In this example the internal data bus drivers have been traced to ascertain if more than one driver is active simultaneously. The lines that are highlighted in Figure C-12 indicate the situation when more than one driver is driving the bus. As each of the highlighted lines are indicating a zero execution count, this means that the situation where more than one driver has driven the bus has never occurred.
|
|
|