 |
Appendix D
VHDL Coverage Analysis - Worked Examples
In this section we will run coverage analysis on a simple VHDL example. The software we will use is Verification Navigator 2002.03 from TransEDA. At the time of going to print this was the only commercially available general purpose coverage analysis tool for VHDL. The following environment will be used:
Verification Navigator supports a number of simulators and operating systems, if your configuration is different please contact TransEDA for an alternative set of instructions on how to run the worked example and case study.
Getting Organized
It is assumed that Verification Navigator and ModelSim have both been installed according to the vendor's instructions and that the necessary environment (PATH etc.) has been set up to run both tools. If this is not the case, please contact the relevant vendor for technical support before going any further.
The various files necessary to run this case study can be obtained as a single `zip' file (for Windows) or `tar' file (for Unix) from the TransEDA web site at:
If you encounter any problems in obtaining the `zip' file please contact TransEDA at the following e-mail address:
Directory and File Structure
Create a new directory on your system, and then unpack the `tar' file into that directory. The directory should now contain the following files:
Design and test bench VHDL files:
Test vector file (read by test_asic.vhd):
Verification Navigator options file:
Getting The Results
It is possible to run Verification Navigator completely from the graphical user interface (GUI), although in this case study we will run a batch script. Batch operation is commonly used for large designs because it is far easier to write a script once to be re-used many times. In this case study our batch script is called doit.modelsim and its contents is as follows:
The vnlib commands create libraries and set up logical names, and are analogous to the ModelSim vlib and vmap commands. The first command creates a library in the directory called ./vlib with the VHDL logical name `coverlib'. The `work' library is set to be `coverlib' by the second command.
The vnvhdl commands instrument (add extra VHDL to collect the coverage analysis) and compile the VHDL files. The standard VHDL compilation order rules apply, just as they would for the ModelSim vcom command. The design is compiled bottom up and in the case of controller_e.vhd and controller_a.vhd the entity is compiled before the architecture. The separate entity file is also listed as a declarations file when processing the architecture so all the port types are known. The -noinstrument switch is used to suppress coverage collection on the package file and the test bench. The coverage options for the other VHDL files are defined by the options file vnavigator.par, although these can also be specified on the command line.
The final command in the batch script (vnsim) runs the simulation and collects coverage information. This is analogous to the ModelSim vsim command and runs your normal simulation test bench. The optional -run switch defines how long the simulation is to be run for. If there is more that one test bench for the design the vnsim line would be repeated for each test bench, taking care to choose a different results file name in each case.
To run the batch script the command is:
If your environment has been set up correctly this will create the results file vmm.res. This file is best reviewed using the graphical user interface, although a batch command to create man-readable results files does exist.
To start the graphical user interface the command is:
This action will bring up a top-level flowchart, as shown in Figure D-1, to guide you through the various tools that are available within Verification Navigator's verification environment.
The Verification Flow flowchart, as shown in Figure D-2, is used to allow you to interact graphically with VN-Cover to create libraries, select the design files that you want to instrument and set up communication with your chosen simulator. As we have already generated the results file using the command line script (doit.modelsim) we can skip this stage and move on to inspecting the coverage results.
Click the Results button - the sixth button on the flowchart.
This action will bring up the window as shown below.
Click the Load Results Files button to display the list of results files that are available to you.
Select the file labelled vnavigator.index by clicking the corresponding entry in the Results File(s) pop-up window. This action will load the requested results file into Verification Navigator's internal database area. A summary of the coverage that has been achieved is displayed in the Results Summary window.
Clicking the Detail button, at the base of the Results Summary window, will enable you to obtain detailed information about coverage in specific parts of the design. The action of clicking the Detail button will cause the display screen to change and become populated with the set of six windows as shown in Figure D-5.
The Flow Manager window is really an iconised version of the Verification Flow window and can be used as a way to return to the main flow if you need to repeat the instrumentation or simulation phases.
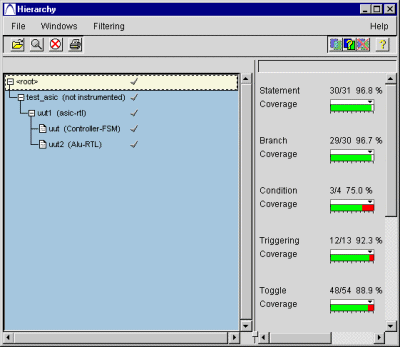
The right-hand section of the Hierarchy window, as shown in Figure D-6, shows a summary of the coverage measurements for the section of the design's hierarchy that is currently selected. At the moment the whole of the design's hierarchy has been selected so what is indicated is a global summary for the whole of the design.

The Hierarchy window shows the cumulative coverage for all the measurements for either the whole of the design hierarchy or a part of it. To see the figures for part of the hierarchy click on the name of the instance at the top of the sub-tree you are interested in. If the overall coverage shown in the Hierarchy window is not acceptable the next step is to investigate the problems. The Metrics View window, shown in Figure D-7, makes this easy by listing, for every coverage measurement, all the design instances in the order of worst coverage through to best coverage. This makes it quick and easy to find the instances with coverage problems.
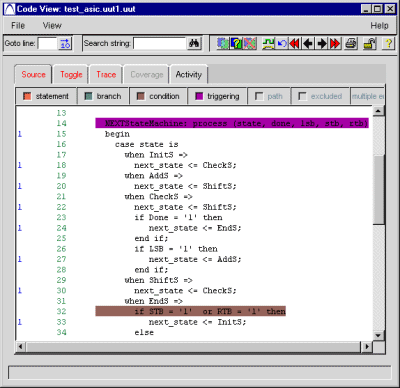
The next step is to click on an instance in the Metrics window which you are interested in (for example test_asic.uut1.uut). This displays the VHDL source code for that instance in the Code View window with color-coded highlighting to show the coverage problems. Figure D-8 shows an example of the Code View window.

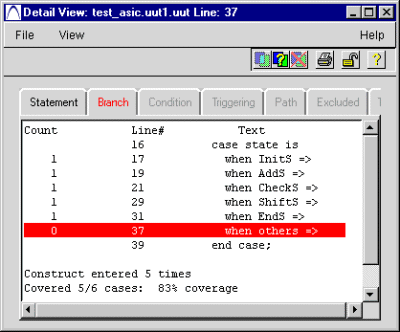
If more detail is required on any coverage problem you can click on the color-coded line to pop up the Detail View window. Figure D-9 shows the branch Detail View window produced by clicking on line 37 of the Code View. The Detail View window shows that one branch of the `case' statement has not been executed.

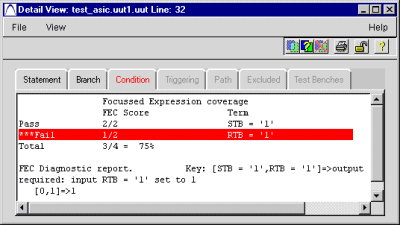
Figure D-10 shows the condition coverage detail created by clicking on line 32 in the Code View window. In this example, the expression has two inputs, and input RTB has not uniquely controlled the expression to logical 1. The report lists the test pattern required to complete the coverage on that expression (STB = 0, RTB = 1).

The detailed toggle coverage information is obtained by pressing on the Toggle tab in the Code View window. Figure D-11 shows an example of this for instance test_asic.uut1.uut2. In this example only one signal has not been toggled by the test bench and is therefore highlighted.
We have worked through the basic principles of collecting and viewing coverage analysis results for a VHDL design. Having identified the coverage analysis problems it is up to you as the designer or verification engineer to decide if the missing coverage is significant and if so how to add extra test patterns to test the uncovered code.
If required additional practical exercises can be obtained from TransEDA and can also be found in the `example' directory where Verification Navigator was installed on your system.
|
|
|