
 |
Chapter 6
Coverage Analysis Measurements
This chapter provides a detailed description of the coverage analysis measurements that can be applied to the development and testing of high quality HDL code. The measurements described are:
It should be noted that the term `coverage metrics' is often used by design engineers to refer to the overall set of coverage analysis measurements mentioned above. It should also be noted that there are a number of coverage analysis tools available in the EDA marketplace that operate on various platforms from personal computers to high-end workstations. Although some of these tools have more coverage measurements than others, Verification Navigator (from TransEDA) has the richest set of coverage metrics and as such will be used for the majority of examples referred to in this chapter. Please note that tools from different vendors may use slightly different terminology to refer to the same coverage analysis measurements. For example, statement and branch coverage is quite often referred to as block coverage.
Coverage metrics can be classified according to the benefit that they offer to a designer and whether the testing strategy is being applied at the structural or functional level.
Structural and Functional Testing
Structural testing, also known as white box or open box testing, is normally applied to sequential HDL code and concentrates on checking that all executable statements within each module have been exercised and the corresponding branches and paths through that module have been covered. If there is a section of HDL code that has never been exercised then there is a high possibility that it could contain an error that will remain undetected. One of the objectives of structural testing is to raise the designer's confidence level that the HDL code does not contain any untested areas and behaves in a manner that closely matches the original design specification. Structural testing can therefore be considered as concentrating on checking that the control logic operates correctly. The coverage measurements that fall into this category are: statement, branch, condition and expression, and path coverage.
Functional testing, also known as black box or closed box testing, is normally applied to HDL code that operates concurrently and concentrates on checking the interaction between modules, blocks or functional boundaries. The objective here is to ensure that `correct results' are obtained when `good inputs' are applied to the various parts of the design, and when `bad inputs' are applied the design operates in a predictable manner. Functional testing can therefore be considered as concentrating on checking that the data paths operate correctly. The coverage measurements that fall into this category are: toggle, triggering, and signal trace coverage.
Statement Coverage
Although statement coverage is the least powerful of all the coverage metrics it is probably the easiest to understand and use. It gives a very quick overview of which parts of the design have failed to achieve 100% coverage and where extra verification effort is needed. Statement coverage is applied to signal and variable assignments in HDL code and gives an indication of the number of times each assignment statement was executed when the design was simulated. A zero execution count pin-points a line of code that has not been exercised that could be the source of a potential design error. The following example shows a line of code that has not been exercised and how this fact could be indicated to a designer using a coverage analysis tool.
Color-coding and error navigation buttons are used by many coverage analysis tools to assist the designer in quickly locating lines of code with zero execution counts. Figure 6-1 shows an example of how zero statement coverage is reported graphically in Verification Navigator.
The figures in the left-hand column of Figure 6-1 indicate the execution count for each statement. The next column gives the line number reference to the HDL source code. Color-coding is used to highlight lines where there are zero execution counts, such as lines 88, 90 and 94 in Figure 6-1.
Statement coverage is also useful in identifying exceedingly high execution counts that could cause potential bottlenecks during the simulation phase or could indicate sections of HDL code that would benefit from being re-written using a more efficient coding style. An example of how high execution counts are displayed in Verification Navigator is shown in Figure 6-2.
Statement coverage problems do not normally occur in isolation, they are usually associated with some other failure within the HDL code. For example, if a branch through a particular piece of code is never taken for some reason, then all the executable statements within that branch will be identified with a zero execution count marker.
If, in Figure 6-3, `a' always equals `b' then statement coverage will be 50% because the block of statements in the FALSE path are never taken.
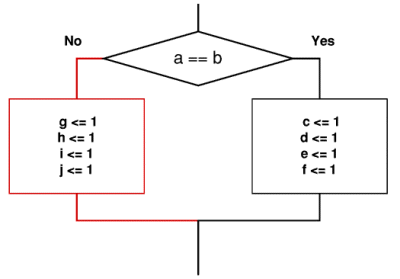
It is advisable to aim for 100% statement coverage before using other, more powerful, coverage metrics.
Branch Coverage
Branch coverage is invaluable to the designer as it offers diagnostics as to why certain sections of HDL code, containing zero or more assignment statements, were not executed. This coverage metric measures how many times each branch in an IF or CASE construct was executed and is particularly useful in situations where a branch does not contain any executable statements. For example, the ELSE branch in an IF statement may be missing or empty, or may contain further nested branching constructs. Quite often, during the development phase of a design, a test bench may be incomplete and may focus on exercising the normal control paths through the module rather than the exceptions. Branch coverage is essential in this situation, as it shows immediately which branches have not been tested.
The example given in Figure 6-4 shows that if `b' always equals `a' then statement coverage will be 100% but branch coverage will only be 50% and the empty ELSE branch is never taken. Just like statement coverage, the aim should be to achieve 100% branch coverage before using other, more powerful, coverage metrics.
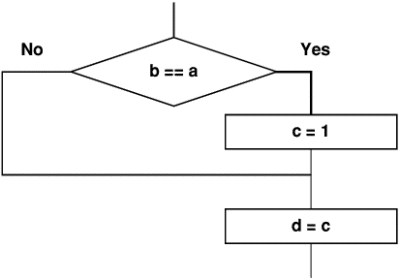
How Branch Coverage is Calculated
During the analysis phase the coverage analysis tool will work out the total number of possible branches that could be taken through the HDL code construct. This value is then compared against the number of branches that were actually taken and the result expressed as a percentage. Figure 6-5 shows that there are three possible branches through the construct and that the construct has been entered 52 times. Although Posedge Clk has been true and false, Reset has always been false which means that only two of the possible three paths through the construct have been taken. If this is expressed as a percentage it will equate to 66% branch coverage.
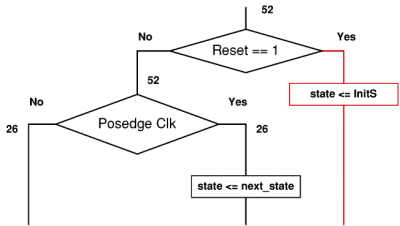
The examples described so far in this chapter use a single condition to control the branch statement. In this situation it is fairly obvious to see why a particular branch was taken or not taken. If the branch is controlled by a series of multiple conditions then it can become more difficult to determine which condition actually caused the branch to be taken. Most coverage analysis tools automatically provide further in-depth analysis for the designer when branches with multiple conditions are detected. This in-depth analysis is known as condition and expression coverage.
Condition and Expression Coverage
Although statement and branch coverage provide an excellent indication of the coverage that has been achieved in a design, using condition and expression coverage can extend the usefulness of this information even further. Condition coverage measures that the test bench has tested all combinations of the sub-expressions that are used in complex branches. The following example shows a code fragment that has a complex condition associated with the branch statement.
In the above example it can be seen that the execution count of zero for if (B=1 and C=0) requires additional test vectors in order to check the branching signals B and C. Using a coverage analysis tool, on this particular line of code, would reveal the actual combinations of the signals B and C that had been exercised. A typical set of condition coverage results for signals B and C is shown in the truth table below.
The above truth table indicates that C=0 has never been true and that extra test vectors are needed for this signal in order to achieve 100% condition coverage.
Most coverage analysis tools should have the capability to enable the results for condition coverage to be displayed in various formats that match the needs of the designer and hence improve overall design productivity.
Multiple Sub-Condition Coverage
Multiple sub-condition coverage is probably the most popular analysis method. The presentation format shows in an easy-to-read truth table layout all the possible combinations associated with the execution of the branch statement. An example of how multiple sub-condition coverage is presented by Verification Navigator is shown in Figure 6-6.
Basic Sub-Condition Coverage
This analysis method checks that each term in the sub-expression has been both true and false during the simulation phase. Again it is fairly normal for the coverage results to be displayed in a tabular format or truth table layout. Consider the following line of pseudo HDL code.
A typical set of output results for the above expression displayed in basic sub-condition format is shown below.
Each term, in the branch expression, is listed on separate lines together with a count of the number of times that term was true and false. Obviously an extra vector is required in the test bench to check the condition for when B is true.
Although basic sub-condition coverage is the simplest criteria to understand and use, it does not uncover possible coding errors in the logic where an AND function should have been used instead of an OR function or vice-versa. For example, if the two vector sets of (a==0, b==0) and (a==1, b==1) were used to test the two branch statements if (a || b) and if (a && b), then basic sub-condition coverage will indicate all combinations have been covered. This means that a logical coding error in the design would go un-noticed and may not get picked up until much later in the development phase. Multiple sub-condition coverage on the other hand would indicate a zero execution count for the missing vector sets of (a==0, b==1) and (a==1, b==0).
Directed or Focused Expression Coverage (FEC)
Some coverage analysis tools offer a directed or focused expression coverage facility that helps to identify the minimum set of test vectors needed to fully validate complex branch expressions. The idea behind focused expression coverage is very simple and is based on the fact that when a designer writes a Boolean expression, the expression is an equation with a number of inputs (signals or variables in the HDL description) combined with Boolean operators (AND, NAND, OR, NOR, NOT or EXOR). If a signal or variable is used as an input to an expression, then that input needs to control the output of the expression otherwise that input is redundant. Focused expression coverage requires that for each input there is a pair of test vectors between which only that input changes value and for which the output is true for one test and false for the other.
As an example consider the expression
The test vectors which satisfy the focused expression coverage criteria for input `a' are (a = 0, b = 1) and (a = 1, b = 1). Likewise, the test vectors for input `b' are (a = 1, b = 0) and (a = 1, b = 1). Because the vectors (a = 1, b = 1) are common to both inputs the actual number of tests needed to fully validate the above expression is 3. Figure 6-7 shows the test patterns that would be required for an expression consisting of AND and OR operators.
Although the reduction in the number of test vectors (from 4 to 3) may not at first sight appear very significant, the productivity benefit becomes substantial as the number of input terms in the expression increase.
Figure 6-8 illustrates the dramatic reduction in the number of test vectors that are needed when the focused expression methodology is used. As many companies estimate that testing can account for 60%-70% of the total development effort on a project, any effort that can be trimmed in this area will have a positive effect on reducing time-scales and will make savings in the overall budget. Furthermore, testing quite often involves `shaking out' a suitable set of test vectors that will adequately exercise the circuit and promote the designer's confidence that the design works correctly and meets specification. Adopting a test strategy that minimizes the number of required test vectors will be highly beneficial both in terms of the time and the effort allocated to the project. One of the simplest and most common testing strategies is the `exhaustive test' where every conceivable pattern is applied to the design under test. This particular testing technique is fairly popular because it is quite easy for a designer to write a test program to cycle through all the input combinations. However, the shortcomings of this particular testing method soon become apparent when a simple logic circuit consisting of N-inputs (i.e. an expression consisting of N-terms) is examined. Clearly the number of test vectors that will be needed if the exhaustive testing strategy is adopted will be 2N for an N-input circuit.
Assuming that test vectors could be applied to the module under test every 100nS, then Figure 6-9 clearly shows that the exponential growth in testing time is unacceptable and that a more efficient method must be found and adopted in the testing arena.

Unfortunately, alternative testing techniques usually involve a fair amount of effort on the part of the verification engineer, developing a dedicated testing strategy and compiling a unique set of test vectors. The focused or directed expression coverage methodology, as implemented by TransEDA, concentrates on choosing the most effective test vectors without the need to use every possible combination of input pattern. For example, if the HDL code fragment if (B==1 and C==0) was simulated with an incomplete set of test vectors e.g. (B=0, C=1) and (B=1, C=1) the graphical output, as illustrated in Figure 6-10, would be produced.
The focused expression coverage score, as reported in the central column of Figure 6-10, shows that the term B==1 completely failed to control the branch and that term C==0 only achieved partial control, as only one correct vector out of a possible two vectors satisfied the FEC criteria. The usefulness of this particular methodology is enhanced by the inclusion of a diagnostic report that identifies missing vectors. In this case the missing vectors are (B=0, C=0) and (B=1, C=0). It is a relatively easy task for a verification engineer to add the missing test vectors to the test bench, thereby achieving 100% condition coverage for this particular branch statement.
Path Coverage
If one complete branching statement follows another branching statement in a sequential block of HDL code, then a series of paths can occur between the blocks. The branching statement can be an IF or a CASE statement or any mixture of the two. Path coverage calculates how many combinations of branches in the first construct and branches in the second construct could be entered. It then measures how many of these combinations were actually executed during the simulation phase and expresses the result as a percentage. As an example, consider the two consecutive IF constructs shown in Figure 6-11. Although there are 4 paths through the complete construct and every branch has been taken at least once, it is not clear whether all the paths have actually been taken.
Figure 6-12 shows, using a flowchart format for illustration purposes, how the path coverage metric would measure the outcome of the decision for each branch and uses this information to identify paths that have a count of zero.
The listing below shows a possible way for a coverage analysis tool to show the path analysis results for a piece of HDL code that contains two consecutive decision statements at line numbers 38 and 41. It is normal practice to exclude assignment statements from the report in an effort to improve clarity.
The first column shows the execution count while the second column gives the line number of the HDL source code, which can be used for reference purposes. Combining the results in this way gives a very compact overview of which paths require further effort from the verification engineer. Another example showing the importance of path coverage is given in Figure 6-13. In this example it is assumed that the circuit design has been exercised with the test vectors (a=1, b=1) and (a=0, b=0). A verification engineer may be justifiably pleased with the results that showed that 100% statement and branch coverage was achieved, and then get alarmed when it is discovered that only 50% path coverage was achieved. In this particular example the path that assigns operand=0.0 (in the first IF statement) and result=1.0/operand (in the second IF statement) never gets executed. This means that the potentially dangerous calculation of 1/0.0 never occurs.
Although a designer should aim for 100% path coverage, in reality this may be difficult or impossible to achieve so a more realistic target may be 85% coverage. For example, if the variable assignments in the first or upper branch are not related to the second or lower branch then there is no reason to check path coverage through this particular construct.
Toggle Coverage
Toggle coverage has a slightly different terminology and interpretation depending on whether the Verilog or VHDL hardware description language is being used. If Verilog is being used then toggle coverage is known as variable toggle coverage and checks that each bit in the registers and nets of a module change polarity (i.e. `toggles') and are not stuck at one particular level. If, on the other hand, VHDL is being used as the design language then toggle coverage is know as signal toggle coverage and evaluates the level of activity for each bit of every signal in the architecture. For a full toggle, a bit must change state, for example 0->1 and then change back again from 1->0.
Toggle coverage is a very useful coverage measurement as it shows the amount of activity within the design and helps to pinpoint areas that have not been adequately verified by the test bench. It can be applied to structural or white box testing to prove that the control logic of the design is functioning correctly, and also to functional or black box testing to prove that signals that cross module boundaries are toggling adequately. The listing below shows a possible way for a coverage analysis tool to show the toggle coverage for a piece of HDL code that contains a register.
In the above example only bit aa[1] has made a full toggle with a positive edge and negative edge transition, so this is the only bit that is entered into the summary list. Bit aa[0] has no toggle activity whatsoever, while bits aa[2] and aa[3] have made a single excursion as a positive edge and negative edge respectively. All of these bit-signals need further verification effort to be deployed in improving the quality and number of vectors supplied by the test bench. Figure 6-14 shows how toggle coverage would be reported graphically in Verification Navigator.
Triggering Coverage
Triggering coverage is normally applied to designs written using the VHDL hardware description language. It checks that every signal in the sensitivity list of a PROCESS or a WAIT statement changes without any other signal changing at the same time. The following listings show two practical examples of how triggering coverage can be used to uncover `logical' design problems.
Here the process contains an important action that will be activated whenever either of the two input signals reset1 or reset2 changes state. It could be that an error exists in that the designer did not actually intend to shut down the system via the reset2 signal. If the test bench always results in reset1 changing whenever reset2 changes, then this error would not be detected without a coverage analysis tool. The listing below shows another example of a possible design problem.
Here, because of the order of priority within the IF...ELSIF block, the assignment to signal c would not occur if signals reset1 and reset2 were to change simultaneously. This behavior may not be the intention of the designer and would be highlighted if triggering coverage were used during the testing phase.
Triggering coverage also provides useful information as to the overall synchronous or asynchronous nature of the system by indicating if inputs to processes are changing simultaneously. Figure 6-15 shows how triggering coverage would be reported graphically in Verification Navigator.
The above example shows that only 5 out of the 12 signals, in the sensitivity list for the Arbiter, have triggered the process. Signals that have not triggered the process are highlighted so they can be visually isolated easily.
Signal Tracing Coverage
Signal tracing coverage has a slightly different terminology and interpretation depending on whether the Verilog or VHDL hardware design language is being used. If Verilog is being used then signal tracing coverage is known as variable trace coverage and checks that variables (i.e. nets and registers) and combinations of variables take a range of values. If on the other hand VHDL is being used as the design language then signal tracing coverage will check that signals and combinations of signals within VHDL architectures take a range of values.
A data file, which is normally formatted as a simple text file, defines the names of the signals/variables to be traced, the type-declaration for the signals/variables and the lowest and highest possible values of the signals/variables to be traced.
Signal tracing coverage can be used in situations where a signal/variable represents the state of a system. For instance where a variable is used to represent the state register of a Finite State Machine (FSM). Whenever a change in any of the selected variables is detected, the current values of all the variables is logged and used to build up a variable trace table. Selecting more than one signal/variable for analysis with tracing coverage allows the state of several FSMs to be monitored, so that the logged values of the signals/variables represent a particular concurrent state of the system. Signal tracing can also be used to monitor any combination of input variables to a block and thus can be extremely useful at the functional or black box testing level.
An example of how signal tracing coverage would be reported by a typical coverage analysis tool in textual format is shown below.
The tabulated information shows that input combination for Done=1, LSB=1 did not occur as shown by the zero execution count in the first column of the table. The above example used the following signal trace definition file to specify the signals to be traced.
If the signals had been a vector (i.e. BIT_VECTOR, STD_VECTOR, STD_ULOGIC_VECTOR) rather than a single bit, then the lower and upper bounds (i.e. the tracing range) for each signal would need to be specified in the definition file, e.g:
Dealing with Information Overload
Most coverage analysis tools are capable of producing vast quantities of information especially if a designer switches on all the coverage measurements for the whole of the design hierarchy. This means that in some situations the use of coverage analysis tools can be counter-productive as the designer ends up spending more time sifting through vast amounts of information rather than fixing design errors. The user obviously needs to be offered some method of filtering or extracting information for selective parts of the design. In this way the user can be directed to the areas of the design that need the most attention. Some of the methods that can be employed with coverage analysis tools to avoid overloading a user with too much information are:
Although the first method (i.e. only collect pertinent information) appears to be fairly obvious, it is amazing how many times this simple fact is overlooked which means that in a number of situations valuable time is wasted collecting and deciphering unnecessary data. As has been stated earlier, one useful guideline for a verification engineer is to concentrate on achieving 100% statement and branch coverage before using the more powerful coverage measurements. It therefore makes sense to restrict initial data collection to just statement and branch when using a coverage analysis tool.
Most complex projects are normally built up from smaller and usually less complex building blocks. Some of these building blocks may be newly designed and carry a degree of risk as they are unproven, while others may have been taken from an established project where they have undergone extensive testing. Another useful guideline for the verification engineer is to partition the complex design into smaller manageable blocks so that effort can be concentrated on those areas that carry the greatest risk. The majority of coverage analysis tools have a hierarchy browser that enables a verification engineer to rapidly traverse the hierarchy and navigate to the `problem' areas. Figure 6-16 shows how the hierarchy browser has been implemented in Verification Navigator.
In the above example the user is presented with a split window. The left-hand section of the window is the hierarchy browser and gives an overall view of the hierarchy and shows how the various modules or units are related to each other. The right-hand section of the window gives a summary of the various coverage analysis measurements for the part of the hierarchy that has been selected. In this particular case the hierarchy browser is viewing the design from the root of the project, so the information shown in the left-hand part of the window represents a global summary of the results for the whole project. If a module in another part of the hierarchy is selected, by pointing and clicking on the appropriate part of the hierarchy browser, then the information displayed in the right-hand section of the window will change accordingly. The tick marks that appear in the left-hand window are used to visually indicate which parts of the hierarchy browser are being reported in the summary window.
Another useful facility that most coverage analysis tools have is a mechanism to filter the coverage results by temporarily turning off the reporting of one or more of the coverage metrics. This has the effect of reducing the amount of data that is presented to the user and therefore helps to direct the user quickly to the problem areas within the HDL code. Figure 6-17 shows how TransEDA have implemented filtering in their Verification Navigator coverage analysis tool.
The above example shows how filtering of the coverage analysis measurements has been applied at the module level (upper figure) using a series of tabs that are selected by the user. The lower figure, in the above example, shows how filtering at the detailed code level is achieved using a series of check-buttons that activate or deactivate the appropriate coverage analysis measurement. In the extreme case, all but statement coverage could be turned off to isolate the basic coding problems associated with the HDL. Then additional check-buttons could be activated to cover the more involved stages of verification. Again the judicial use of color-coding is important as it can make the interpretation of the results easier to assimilate and understand for the user.
Another method of reducing the information overload is to rank the results using some suitable criteria. The ranking could be based on the `seriousness of the error', with the modules that have the most number of errors being presented first. Alternatively, ranking could be based on simply listing the modules in alphanumeric order. Figure 6-18 shows how ranking has been implemented in Verification Navigator.
The above description gives practical guidelines for dealing with the information overload that can result when coverage analysis is applied to every module and unit in the design project. Another method is to exclude complete or partial sections of HDL code from the analysis and reporting phases of coverage analysis, thereby saving valuable time at the detailed verification stage.
Excluding Code
As it normal practice to set up a batch file to define the HDL source files that are to be analyzed by the coverage analysis tool, it is a simple matter to delete the file or not include it in the list to prevent it from being analyzed. Some coverage analysis tools allow the user to exclude one or more lines of HDL code in various sections of the source files. This is particular useful in situations where a CASE or nested IF constructs contain a `default' block that is not normally executed. For example, a block of code that is only executed under error conditions to print out an error message. In this situation is would be extremely difficult to obtain 100% statement covered. By excluding the `default' block of code, coverage can be improved and the possible target of 100% reached. Obviously it would be unwise for a verification engineer to exclude all the HDL code in a module in order to achieve 100% coverage, so most coverage analysis tools safeguard this situation by reporting on excluded lines of code that have been executed. In practical terms this means that code that should be excluded is usually identified with in-line markers that turn-off and turn-on the coverage analysis locally within the HDL file. An alternative method is to apply post-simulation results filtering to the coverage data. Normally this is achieved graphically by allowing the user to dynamically mark the lines of code that are to be excluded. This process is often know as `on the fly code exclusion.'
Post-Simulation Results Filtering
If coverage analysis were to be applied to the following piece of HDL code it would be impossible to achieve 100% statement and branch coverage because the `default' clause cannot be exercised. In this particular example it is impossible to execute the `default' clause because all the possible combinations that A and B could take have already been covered by the individual case-terms contained within the construct.
.
Although it is tempting to question the relevance of the `default' clause in this particular example, as it appears to be superfluous, it is generally regarded as good coding practice to include a `default' clause (in a Verilog case construct) or a `when others' clause (in a VHDL case construct) to help improve the efficiency of the synthesis process. The detailed view of the report file, as shown in Figure 6-19, shows that the branch at line 13 has never been executed.
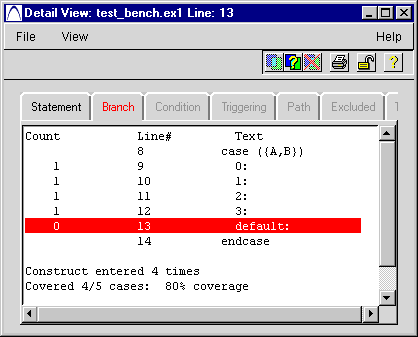
As shown in Figure 6-20, selective parts of the HDL code can be marked for filtering by dragging the cursor through the appropriate lines of code (lines 13 and 13a in this example) and then clicking the filter button located at top-right edge of the window.
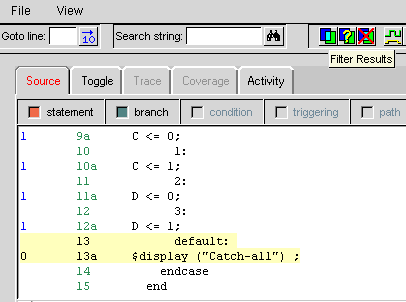
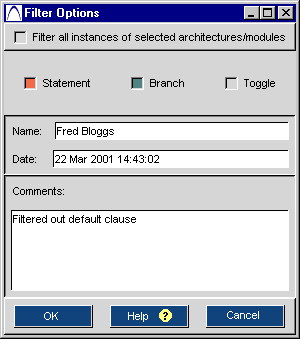
This action will cause a mini-window to be displayed where basic information can be recorded for documentation purposes. Figure 6-21 shows how the name of the person responsible for applying the filter and the reason why it was necessary to filter this particular piece of code are recorded. The date/time are automatically inserted.
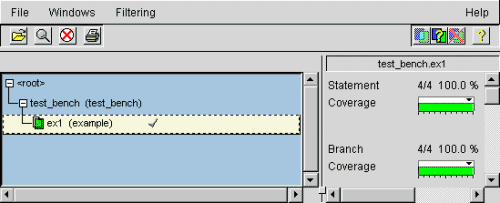
One method of showing that one or more lines of code have been filtered-out can be achieved by appending a letter F against the particular module or instance in the window that reports the overall coverage analysis measurements. Figure 6-22 shows how post-simulation results filtering is presented to the user in Verification Navigator. As soon as the `default' clause is filtered out, the coverage results are automatically recalculated (by Verification Navigator) and the updated results displayed to the user. In this particular example, as shown in Figure 6-22, the statement and branch coverage has increased to 100%.
Each time a user filters or un-filters a section of HDL a text file is updated in the background which is used to maintain a record of exactly what is currently filtered within each module or instance. As well as holding basic documentation information, the text file also ensures consistency from one coverage analysis run to another.
A set of three buttons, which are available at the top-right of each main window, are used to control the filtering facility. The button on the left filters any highlighted section while the button on the right removes the filter. The button surmounted with a question mark interrogates the text file (maintained by Verification Navigator) and displays the current filtering information. This information can optionally be printed and used for documentation purposes on the design project.
Although the above example has shown how a section of HDL code can be filtered, it is also possible to filter out one or more complete modules or instances. For example a designer may be using a block of IP (Intellectual Property) or some legacy code that has been verified previously on another project. Providing the designer is confident that the verification procedures that were applied to these blocks of code were of a sufficiently high standard then any need for further testing can be avoided.
Figure 6-24 shows how module or instance filtering is achieved by selecting the appropriate items in the hierarchy view window and then clicking the filter button on the top-right of the window.
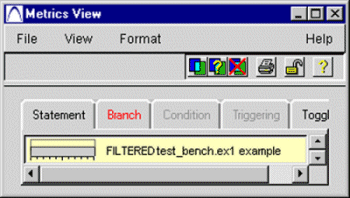
Whenever a complete module or instance is filtered-out this fact is shown to the user by greying out the coverage values on the coverage analysis measurements window. An example of how this situation is conveyed to the user is shown in Figure 6-25.
Summary
The guidelines that have been introduced in this chapter are summarised below.
… Wherever possible always partition the overall design into sub-modules or sub-units so that the functional boundaries are obvious and well defined.
… Avoid wasting valuable simulation time by collecting only the coverage data that is actually needed. For example, during the initial verification phase, probably only statement and branch information needs to be collected.
… Concentrate the verification effort on proving that the control logic of each module or unit operates correctly. The initial target should be 100% statement and branch coverage. Once this has been achieved additional coverage measurements, such as condition coverage, path and toggle coverage can be applied to the unit or module. Although a target of 100% condition coverage should be achievable, a verification engineer may have to accept a lower value of 85% for path coverage.
… Use statement, branch, condition, path and toggle coverage measurements to prove the control paths in each unit or module.
|
|
|