
 |
Chapter 12
Analyzing and Optimizing the Test Suite
The Test Suite
One of the main objectives faced by the verification engineering team is to try and establish a test suite that contains the minimum set of productive test benches and as few duplicated or repeated tests as possible. If this can be achieved then it will save valuable simulation time whenever an engineering change is made to one or more of the HDL coded modules, by ensuring that only the productive test benches are re-run. The temptation here is that due to the amount of manual effort involved in sorting out which test benches are the best ones to re-run, a verification engineer re-runs the whole suite and reluctantly accepts the ensuing time penalty.
Using a test suite analysis tool, this otherwise labour intensive task can be automated thereby saving considerable time during the verification phase of the project. Probably one of the best-known test suite analysis tools in use today is CoverPlus from TransEDA. Recently this point solution tool has been renamed as VN-Optimize and incorporated into the verification environment known as Verification Navigator to form a highly integrated and comprehensive coverage analysis product. The remainder of this chapter uses a number of screen shots to illustrate how this particular test suite analysis tool can be successfully incorporated into the verification phase of the project's design flow.
The set of results, as detailed below, show the percentage of coverage analysis and simulation time that was obtained when the 6 test benches were run independently of each other on part of a design.
Although it is fairly easy to see, from Table 12-1, that test_monitor gave the maximum amount of coverage in the shortest amount of simulation time, it is not immediately obvious how much overlap there is between the other tests and whether any tests possibly duplicate one other.
Figure 12-1 shows the situation immediately after the 6 test bench results files have been read into Verification Navigator. At this stage the history files (i.e. test bench results files) are displayed in random order.
The test suite analysis tool within Verification Navigator offers a Sort facility whereby the test bench results are sorted according to a criterion set by the user. An example showing the effect of sorting the results based on statement and branch is shown by Figure 12-2.
As shown in Figure 12-2 test_monitor1, test_monitor2 and test_monitor4 are the only productive tests for this particular design and that maximum coverage of 85.95% is reached after 3 minutes and 41 seconds of simulation time. The test suite analysis tool achieves this by ranking the results files so that the files that give the maximum amount of coverage in the minimum amount of time are placed in priority order at the top of the list. What is even more revealing is that the other 3 tests (i.e. test_monitor3, test_monitor5 and test_monitor) did not increase the amount of coverage; they only wasted valuable simulation time.
Using the information given in Table 12-1 it can be calculated that even with this simple design the last 3 tests actually wasted 3 mins 8 seconds of simulation time. (i.e. test_monitor3 wasted 1 minute 15 seconds, test_monitor5 wasted 1 minute 13 seconds, and test_monitor wasted 40 seconds.) This wasted time equates to 45.96% of the total simulation time and that dispensing with these tests would save a significant amount of simulation effort.
Regression Testing
During the development and verification phases of a project, changes can occur that affect the operation of an individual module or unit and potentially how that unit interacts with the remainder of the system. Whenever an ECO (Engineering Change Order) occurs the appropriate suite of tests must be re-run to prove that any changes have not adversely affected the operation of the rest of the system. The verification team is faced with a difficult choice at this stage. Do they re-run all the tests or a unique sub-set? The decision here is between the amount of simulation time that can be devoted to this task and the minimum level of coverage analysis that is deemed acceptable. Most companies tend to approach this problem by establishing a set of sorting criteria based on running the regression test suite on a daily, weekly or monthly basis.
Verification Navigator contains a control panel where a user can set the regression settings that match the needs within their particular company. Figure 12-3 shows the Sorting Criteria panel settings that are typically used for daily regression testing.
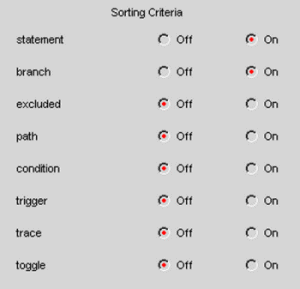
Although settings tend to vary from company-to-company, typical settings for weekly coverage are normally based on achieving maximum statement, branch, condition and toggle coverage. Monthly regression settings are normally based on achieving maximum coverage on all coverage settings. An example of how different coverage settings can affect the overall results is shown in Figure 12-4 where a monthly regression setting (i.e. all coverage settings switched-on) has been used.
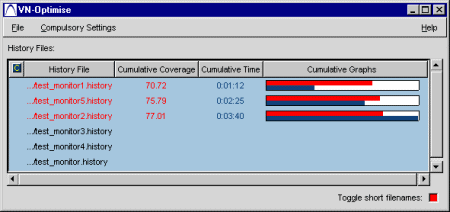
Figure 12-4 shows that when the monthly regression settings are used the optimizer tool alters the sequence for running the tests in order to achieve a maximum coverage of 77.01%. In this particular example, the optimized list now includes test_monitor5 between test_monitor1 and test_monitor2. Also test_monitor4 is no longer included in the list as its coverage has already been covered by one or more of the other tests. It should also be noted that the maximum coverage achieved is significantly lower than the coverage that was obtained when the daily sorting criteria was used as in Figure 12-2.
Merging Test Bench Results
Although the examples that have been considered so far in this chapter only contain a small number of results files, it is sometimes convenient to merge one or more test bench results files to speed-up the loading process and improve the readability and interpretation of the messages produced by the test suite analysis tools.
As an example, consider the test bench results files shown in Figure 12-4. The first 2 files could be merged together by selecting the corresponding files and then clicking the Merge button. This action, which is shown in Figure 12-5, creates a new combined file, which in this particular case has a default file name of merged.history. If required, the user can provide an alternative file name to match the naming convention that is used by the verification engineering team.
Optimizing the Test Benches
Looking at the results shown in Figure 12-5, it can be seen that the merged results file merged.history gives 75.79% coverage for the design after 2 mins 25 secs of simulation time. The amount of coverage can be increased by 1.22% to 77.01% by including test_monitor2 in the test suite but this is at the expense of additional simulation time. In this particular case the extra simulation time that is needed to achieve this is 1 min 15 secs. If these figures are expressed as percentages of the original coverage value and simulation time, then they equate to an increase of 1.6% coverage for an increase in 51.7% simulation time. The immediate reaction to these figures prompts the question as to whether test_monitor2 should be included in the test suite. A better alternative might be to optimize the merged test bench file so that it includes the incremental difference that test_monitor2 contributes. The success of this strategy obviously relies on how much effort it will take to isolate the incremental difference for this particular test bench.
The test suite analysis tool within Verification Navigator offers a facility to create lists of results files and then perform various comparisons and isolate any differences. Figure 12-6 shows pictorially how the 2 results files are related to each other and the calculation that needs to be made to extract the value of the difference.
e.g. Difference = (merged + test_monitor2) - merged
Figure 12-7 shows how the above `difference calculation' is setup using the Compare facility in Verification Navigator.
As shown in Figure 12-7 there are 3 buttons (labelled Only A, A and B and Only B) that enable various types of calculations to be performed between the results files that appear in List A and List B. In this particular example the Only A button is clicked, as it is the difference, after subtracting List B from List A, which is required. When any of the 3 buttons are clicked a series of calculations are performed on the two sets of results files, and the global results reported to the user. Figure 12-8 shows how Verification Navigator identifies where the various differences exist and how this information is conveyed graphically to the user. A row of tabs labelled with the coverage measurements (i.e. Statement, Branch, Condition, Toggle and Path) can be selected individually if a user requires more specific details.
The first line entry, in Figure 12-8, shows that the test bench test_monitor2 did not execute any additional statements not executed by the merged test bench in the design unit named test_monitor. The second and third line entries show that 1 extra statement was executed by test_monitor2 while the fourth line entry shows that 3 extra statements have been executed. (i.e. Figure 12-8 shows a summary of the incremental contribution made by test bench test_monitor2.)
The next step is to inspect the HDL source code and identify exactly where these particular statements are located. Using Verification Navigator this is achieved by simply clicking the appropriate line entry, which invokes a window where the corresponding HDL source code is displayed as in Figure 12-9.
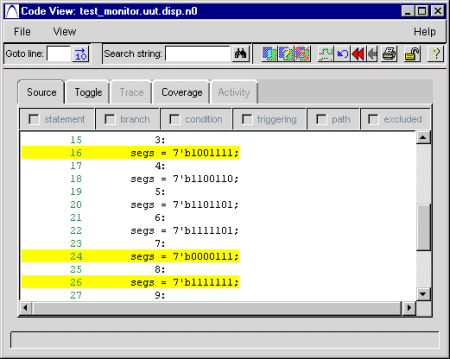
The source code listing, in Figure 12-9, highlights the 3 lines (i.e. lines 16, 24 and 26) that have been executed by the test_monitor2 test bench. Using this information the final step is to optimize the effectiveness of one of the original test benches to include additional vectors that execute these lines of code. In this particular example it means changing any of the 2 test benches (i.e. test_monitor1 or test_monitor5) that were merged to produce the compact test bench file merged.history
Identifying Test Benches for ECO
In a number of situations there is a requirement to be able to identify which test bench or test benches executed a particular line of HDL code. For example when an ECO (Engineering Change Order) occurs, a verification engineer needs to know which tests need to be re-run in order to prove that these changes have not adversely affected the operation of this design unit and its interaction with other parts of the system. Using the facilities offered by Verification Navigator this task can easily be achieved by reading in the various test bench results files and then setting up a single compare list that contains all these files. This sequence is illustrated in Figure 12-10.
The compare button labelled Only A is clicked to invoke file processing and then the design unit that contains the HDL that has been changed is selected. This action will bring up a window, as shown in Figure 12-11, where the individual lines of source code are displayed.
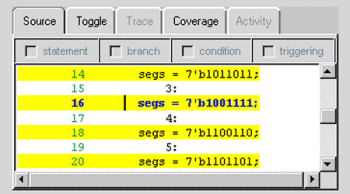
If any of the individual lines of source code are clicked the names of the test benches that executed that line of code is displayed as in Figures 12-12 and 12-13.
Figure 12-12 shows that line 16 in this particular design unit has been executed by test benches: test_monitor1, test_monitor, test_monitor5 and test_monitor4.
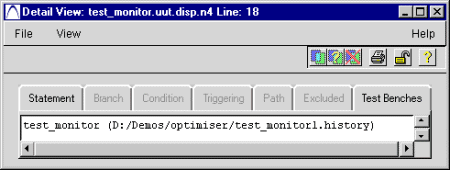
Figure 12-13 shows that line 18, in this particular design unit, has only been executed by test bench: test_monitor1.
Although these have been fairly trivial examples they should illustrate how the relevant test benches can easily be identified when implementing engineering change orders.
|
|
|